
Fil:Butterworth filter bode plot.png

Storleik på førehandsvising: 800 × 560 pikslar. Andre oppløysingar: 320 × 224 pikslar | 640 × 448 pikslar | 1 024 × 717 pikslar | 1 250 × 875 pikslar.
Opphavleg fil (1 250 × 875 pikslar, filstorleik: 110 KB, MIME-type: image/png)
Følgjande er henta frå filomtalen åt denne fila på Wikimedia Commons:
Skildring
| Skildring |
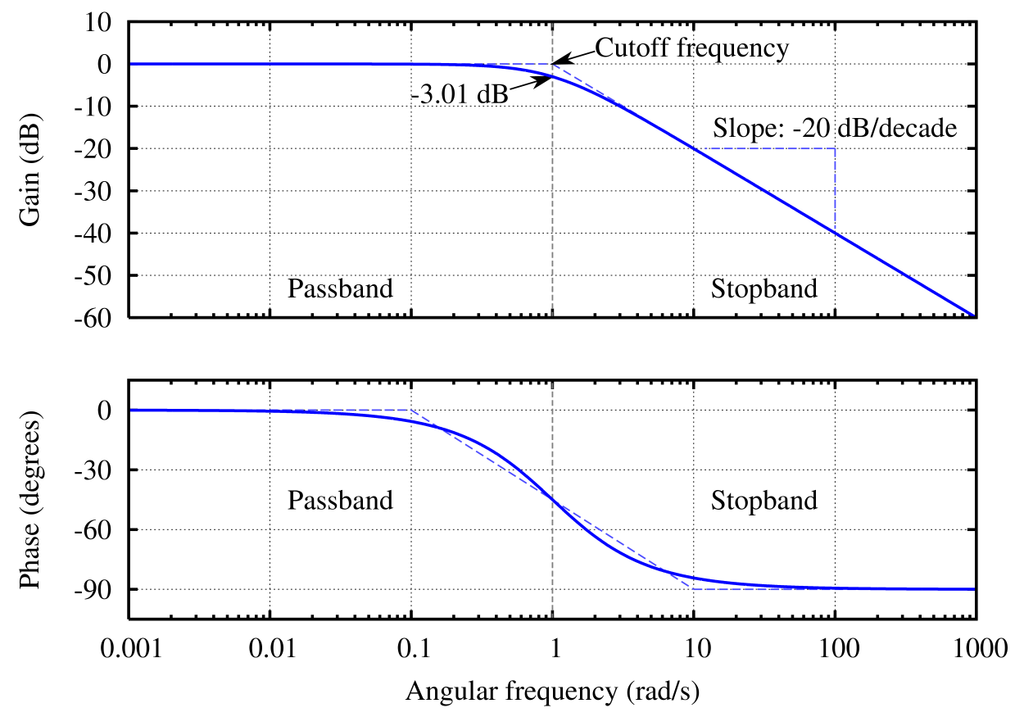
English: The Bode plot of a Butterworth filter with logarithmic axes and various labels. Cutoff frequency is normalized to 1 rad/s. Gain is normalized to 0 dB in the passband. Phase is in degrees because that's typical. The code is kind of kludgy, but makes a good output. See Wikipedia graph-making tips. Generated in gnuplot with the script below (save as butterworth_bode_plot.plt and then open in gnuplot). Then I opened the butterworth_bode_plot.ps file in a text editor to edit the line colors and linestyles, as per this description. This avoids needing to open in proprietary software, and really isn't that difficult (especially if you don't know the commands in the proprietary software either). ;-) Identify the lines easily by their color (the arrow is currently magenta and I want it to be black. Ah, there is the entry with 1 0 1, red + blue = magenta) or by using the gnuplot linestyle−1. (For instance, gnuplot's linestyle 3 corresponds to the ps file's /LT2.) Then you can edit the colors and dashes by hand. I changed the original: /LT0 { PL [] 1 0 0 DL } def
/LT1 { PL [4 dl 2 dl] 0 1 0 DL } def
/LT2 { PL [2 dl 3 dl] 0 0 1 DL } def
/LT3 { PL [1 dl 1.5 dl] 1 0 1 DL } def
into this: /LT0 { PL [] 0 0 1 DL } def
/LT1 { PL [4 dl 2 dl] 0.5 0.5 0.5 DL } def
/LT2 { PL [6 dl 3 dl] 0.3 0.3 1 DL } def
/LT3 { PL [] 0 0 0 DL } def
/LT4–/LT8 I left unchanged. (I don't know what they're used for anyway.) /LTw, /LTb, and /LTa are for the grid lines and such. To convert the PostScript file to PNG:
PNG Rastergrafikken vart laga med Gnuplot. |
| Dato | 8. oktober 2005 (opplastingsdato) |
| Kjelde | Eige arbeid |
| Opphavsperson | Omegatron |
| Andre versjonar |
[]
.png:
|
| gnuplot source | click to expand
set samples 2001
set terminal postscript enhanced landscape color lw 2 "Times-Roman" 20
set output "butterworth bode plot.ps"

# Butterworth amplitude response and decibel calculation.  n is the order, which is just 1 in this image.
G(w,n) = 1 / (sqrt(1 + w**(2*n)))
dB(x) = 20 * log10(abs(x))
# Phase is for first order
P(w) = -pi/2-atan(1.2*w)-atan(0.09*w)

# Gridlines
set grid

# Set x axis to logarithmic scale
set logscale x 10

# No need for a key
set nokey #0.1,-25

# Frequency response's line plotting style
set style line 1 lt 1 lw 2

# Asymptote lines and slope lines are the same "arrow" style
set style line 3 lt 3 lw 1
set style arrow 3 nohead ls 3

# -3 dB arrow style
set style line 4 lt 4 lw 1
set style arrow 4 head filled size screen 0.02,15,45 ls 4

# Separator between passband and stopband line style
set style line 2 lt 2 lw 1
set style arrow 2 nohead ls 2

set multiplot

# Magnitude response
# =============================================
set size 1,0.5
set origin 0,0.5

# Set range of x and y axes
set xrange [0.001:1000]
set yrange [-60:10]

# Create x-axis tic marks once per decade (every multiple of 10)
set xtics 10
#set ytics 10

# No need for two sets of numbers
set format x ""

# Use 10 x-axis minor divisions per major division
set mxtics 10

# Axis labels
set ylabel "Gain (dB)"

# Draw asymptote lines
set arrow 1 from 1,0 to 1000,-60 as 3
set arrow 2 from .001,0 to 1,0 as 3

# -3 dB arrow
set arrow 4 from 2,3 to 1,0 as 4

# "Cutoff frequency" label uses same coordinates as the function
set label 3 "Cutoff frequency" at 2,4 l

# "-3 dB" label
set arrow 5 from 0.5,-6 to 1,-3 as 4
set label 4 "-3.01 dB" at 0.5,-7 r

# Draw a separator between passband and stopband and label them
set arrow 3 from 1,-60 to 1,10 as 2

# Label coordinates are relative to the graph window, not to the function, centered at the 1/4 and 3/4 width points
set label 1 "Passband" at graph 0.25, graph 0.1 c
set label 2 "Stopband" at graph 0.75, graph 0.1 c

# Draw slope lines and label
set arrow 6 from 100,-20 to 12,-20 as 3
set arrow 7 from 100,-20 to 100,-39 as 3
set label 5 "Slope: -20 dB/decade" at 100,-15 c

plot dB(G(x,1)) ls 1  title "1st-order response"

#Phase response
# =============================================
set size 1,0.5
set origin 0,0

# Set range of x and y axes
set yrange [-105:15]

# Create y-axis tic marks every 15 degrees
set ytics 30

# Regular numbers
set format x "% g"

# Axis labels
set ylabel "Phase (degrees)"
set xlabel "Angular frequency (rad/s)"

# Draw asymptote lines
set arrow 1 from 0.1,0 to 10,-90 as 3
set arrow 2 from 0.001,0 to 0.1,0 as 3
set arrow 10 from 10,-90 to 1000,-90 as 3

# -3 dB arrow
unset arrow 4 #from 2,3 to 1,0 as 4

# "Cutoff frequency" label uses same coordinates as the function
unset label 3 #"Cutoff frequency" at 2,4 l

# "-3 dB" label
unset arrow 5 #from 0.5,-6 to 1,-3 as 4
unset label 4 #"-3.01 dB" at 0.5,-7 r

# Draw a separator between passband and stopband and label them
set arrow 3 from 1,-105 to 1,15 as 2

# Label coordinates are relative to the graph window, not to the function, centered at the 1/4 and 3/4 width points
set label 1 "Passband" at graph 0.25, graph 0.5 c
set label 2 "Stopband" at graph 0.75, graph 0.5 c

# Draw slope lines and label
unset arrow 6 #from 100,-20 to 12,-20 as 3
unset arrow 7 #from 100,-20 to 100,-39 as 3
unset label 5 #"Slope: -20 dB/decade" at 100,-18 c

plot P(x) ls 1 title "Phase response"

unset multiplot
|


|
Ein vektorversjon av dette biletet (SVG) er tilgjengeleg.
Han bør verta nytta i staden for dette rasterbiletet der han er betre. File:Butterworth filter bode plot.png → File:Butterworth filter bode plot.svg
For meir informasjon om vektorgrafikk, les om overgangen til SVG på commons. Det finst òg informasjon om støtta MediaWiki har for SVG-bilete. |
 |
Lisensiering:
Eg, opphavsrettshaldaren til verket, publiserer det hermed under desse lisensane:
Denne filen er lisensiert under lisensene Creative Commons Navngivelse-DelPåSammeVilkår 3.0 Unported, 2.5 Generisk, 2.0 Generisk og 1.0 Generisk.
- Du står fritt til å:
- til å dela – til å kopiera, distibuera og overføra arbeidet
- til å blanda – til å endra verket
- På desse vilkåra:
- namngjeving – Du lyt godskriva verket på den måten som opphavpersonen eller lisensgjevaren har oppgjeve (men ikkje på ein slik måte at det kan verka som om dei går god for deg eller måten du nyttar verket på).
- del på same vilkåra – Om du remiksar, omarbeider, eller på annan måte byggjer på dette verket, kan du berre distribuera resultatet under den same eller ein samsvarande lisens som denne.

|
Det er tillate å kopiera, distribuera og/eller modifisera dette dokumentet under retningslinene som er skildra i GNU fri dokumentasjonslisens, versjon 1.2 eller seinare utgåve utgjeven av Free Software Foundation; med alle seksjonane, utan nokon framsidetekstar og baksidetekstar. Ein kopi av lisensen er inkludert i avsnittet GNU Free Documentation License. |
Du kan velje den lisensen du sjølv tykkjer er best.
Filhistorikk
Klikk på dato/klokkeslett for å sjå fila slik ho var på det tidspunktet.
| Dato/klokkeslett | Miniatyrbilete | Oppløysing | Brukar | Kommentar | |
|---|---|---|---|---|---|
| gjeldande | 8. oktober 2005 kl. 22:01 | | 1 250 × 875 (110 KB) | Omegatron | last revision? |
| 8. oktober 2005 kl. 21:41 |  | 1 250 × 875 (113 KB) | Omegatron | better | |
| 8. oktober 2005 kl. 21:30 |  | 1 250 × 875 (117 KB) | Omegatron | The frequency response of a Butterworth filter with logarithmic axes (Bode plot) and various labels. Cutoff frequency is normalized to 1 rad/s. Gain is |
Filbruk
Den følgjande sida bruker denne fila:
Global filbruk
Desse andre wikiane nyttar fila:
- Bruk på eo.wikipedia.org
- Bruk på eu.wikipedia.org
- Bruk på fr.wikipedia.org
- Bruk på he.wikipedia.org
- Bruk på hi.wikipedia.org
- Bruk på pl.wikipedia.org
- Bruk på pt.wikipedia.org
- Bruk på zh.wikipedia.org